Monday, April 6, 2015

The Heart Dissection

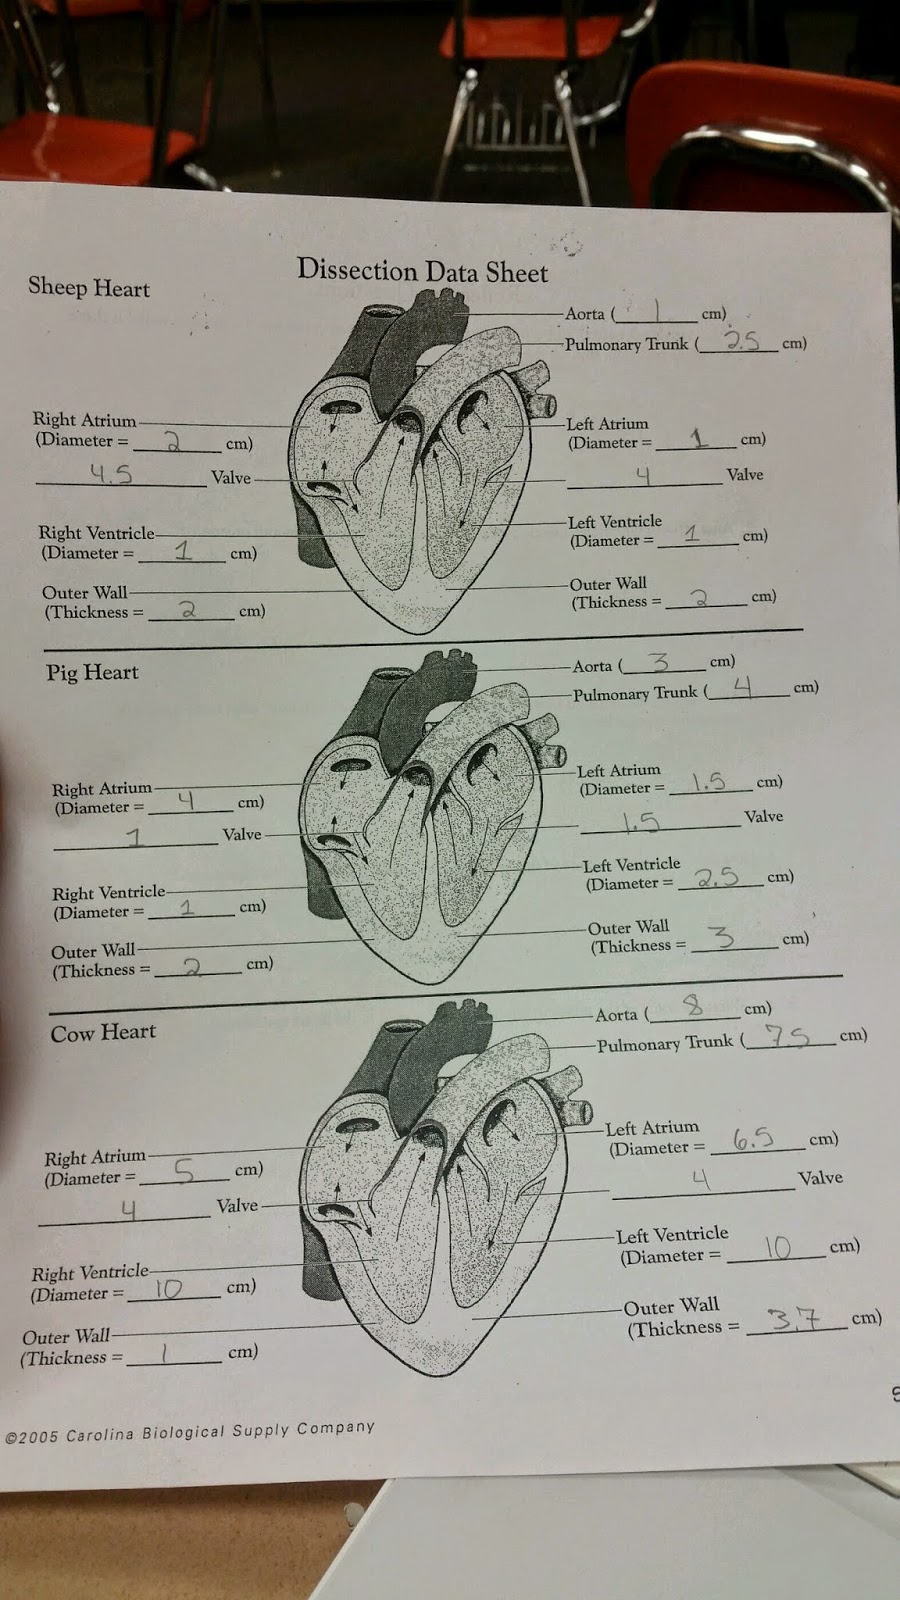
For our dissection, we all spit into groups of four and had to the chance to dissect the hearts of a cow, pig and sheep heart. We cut each heart right down the middle, we located and measured the right-left atrium, right-left ventricle, outer wall for each side, aorta and the pulmonary trunk.


Cow Heart 
 Pig Heart 


 Sheep Heart 

If you click on the picture below, you will notice all the measurements of the hearts parts for all three hearts. 

Thursday, April 2, 2015

Just Dance vs Zumba


Question: Which form of exercise (Zumba or Just Dance) would cause a person’s heart rate to be higher?


Hypothesis: If we compare Zumba and Just Dance heart rates, then zumba will lead to a higher heart rate because we will require more energy to dance Zumba than the required energy it takes for Just Dance.
Procedure:
Just Dance
  1. Record Heart Rate
  2. Picked A Song To Dance To
  3. All 5 Danced To The Same Song
  4. Recorded Heart Rate After Dancing
  5. Repeat Two More Times on Different Days
Zumba
  1. Record Heart Rate
  2. Picked A Song To Dance To
  3. All 5 Danced To The Same Song
  4. Recorded Heart Rate After Dancing
  5. Repeat Two More Times on Different Days
Materials:
  1. Wii & Controllers
  2. TV
  3. Just Dance Game
  4. Computer
  5. Blood Pressure/ Heart Rate Cuff & Monitor


Abstract: Throughout this experiment we were trying to understand which dance workout would increase our heart rate quicker between Zumba and Just Dance. We figured that Zumba would increase the most compared to Just Dance. All five subjects tested through three trials for both Zumba and Just Dance. Their heart rate was measured before and after each song. We came to the conclusion that Zumba led to a higher heart rate with a 17% increase, while Just Dance had a 6.8% increase.

Conclusion:


In our experiment we were trying to find whether Zumba got our heart rate to increase more than Just Dance. We finished our experiment and using our results we were able to prove our hypothesis correct because on average our heart rate increased by 17% by doing Zumba and on average our heart rate increased by only 6.8% with Just Dance.

Sunday, February 22, 2015

Sheep Brain Dissection

In this dissection my group and I dissected a sheeps brain to show we understood how to dissect. We had gathered as much information on each plane of section: saggital, coronal, and horizontal.
Sagittal Plane of Section
  
Coronal Plane of Section
 
Horizontal Plane of Section
 
Sheep Brain


Reflex Lab

Neuromuscular Reflexes Lab\
 
In this lab there was a group of us and we recorded the results from tapping the patellar tendon below the knees with a reflex hammer. This motion caused the quadriceps muscle to contract and the leg would then kick up. When the muscles stretch nerve impulses travel to the spinal cord Motor neurons would then activate and go back to the muscle for the muscle contractions
 
Procedure:
So to begin with we grab a computer and connect the EKG Sensor to the computer, then attach two of the electrode tabs above to subjects knee. The last one should then be placed on the lower leg. The three colored cords should be connected correctly, the red and green should be connected to the electrodes above the knee, the black then connected to the electrode below the knee. Tap the subject with the reflex hammer, then record the voluntary activation data. Afterwards record the patellar reflex  data and the patellar reflex data with reinforcement.
 
First Run 
 
Second Run
 
Third Run

Saturday, February 7, 2015

Diseases of the Nervous System

There are two links below to two different presentations that my group and I created to understand the diseases to the nervous systems. We were able to gain quite a bit of knowledge doing our own research on the diseases. So click on the links to learn a thing or two!!!!
Concussions  &  ALS Disease !!!!

Neurophysiology Drawings

 Neuron- So neurons are specialized to transmit/send information throughout your body. These nerve cells are just like any other cell, they have a nucleus. If you look at the picture above you will see the axons which branch our with long tails. They are connected to the axon terminal.
Ion Channels- They are made up of membrane proteins. Ion Channels allow some ions to pass through and prevents some others to pass, they are very selective. The ions diffuse and follow their electrochemical gradients as gate ions channels open. This tends to create electrical currents and voltage changes across the membrane.
Membrane Protein Pump- This is when the potassium has to come out to equalize the charges when the sodium pumps in.
Synaptic Potential- A synaptic potential occurs when neurons connect. It comes in two forms which are excitatory and inhibitory. So the sodium receptors detect the synapse and sodium is released into the membrane. The inside starts to become less negative while the outside will do the opposite and become less positive.
Resting Potential- When a neuron is not sending a signal it is at rest, the inside of the neuron is negative relative to the outside. The resting membrane potential of a neuron is about -70 mV. So at rest there are more sodium ions outside the neuron and more potassium ions inside that neuron.
Action Potential- An action potential occurs when a neuron sends information down an axon away form a cell body. First a stimulus causes sodium channels to open, sodium ions then rush into the neuron. Sodium has a positive charge, the neuron becomes more positive, it then takes longer for the potassium channels to open. Potassium rushes out of the cell when they open, at this time sodium channels start to close and this action causes the action potential to go toward -70mV and it then goes past -70mV because the potassium channels stay open too long. Eventually ions concentration goes back to resting levels and the cell returns to -70mV


Thursday, January 8, 2015

Sliding Filament Theory

Part One: Create a model or other representation of skeletal muscle anatomy that shows the different levels of structure from the body of the muscle all the way down to the microscopic structure of the muscle fibers, including the banding patterns visible under high magnification.
My group and I decided to create a cake as our model with different color liquorish.
The black side liquorish represented the Z Disc/Sarcomere.
The blue liquorish represented the thin (action) filament.
The red liquorish represented the thick (myosin) filament.
The green liquorish represented the M line.
Thick Filament: is made up of protein myosin only, it lies only in A-band. It is bisected by a proteinaceous line called M-line.
Thin Filament: is made up of proteins-actin, tropomyosin and troponin, it is bisected by proteinacious line called Z-line and lies both in A and I band.
Z Disc: is the center of the I band. The Z Discs re at each end of the Sarcomere.
Sarcomere: is a structural unit of a myofibril in striated muscle, consisting of a dark band and the nearer half of each adjacent pale band.
M Line: is the center of the H Zone, which is the center of the Sarcomere. 
 
Part Two: Choose one of the following physiological processes to study and learn about. Create an online tutorial, movie, or animation that will help others learn about how muscles work. 

Muscle (Chewing) Lab

In this lab we will be monitoring the electrical activity of the masseter muscle as we eat different foods. 
Materials:
Computer
Vemier computer interface
Logger Pro
Vemier EKG Sensor
Electrode tabs
Different types of foods

Question: Do all foods require the same muscle activity?

Hypothesis: If we eat the doritos then there will be more muscle activity because the food is crunchier and takes more to chew. 

Procedure: This lab we had to try different foods and see the results of our muscle movement. We chose 6 different types of foods: peanut butter, cake, Doritos, marshmallows, vanilla wafers, and Twix.  In order to begin the lab, the EMG Sensor w connected to the Vernier computer interface.  So one person was chosen from the group to get the three electrode tabs placed on different areas of the face. The first one was placed facing the ear, the wire was then looped over the ear. The second one was placed facing downwards on the side of the jaw, the wire had hung down this time. The last tab was placed on the right forearm, this one was attached to the black EKG electrode. The first two on the face were attached to the red and green EKG electrodes. The person will then sit with a still jaw to have the graph at a constant rate. Once that is done the person can start eating the different foods and record their results form the graph. The three pictures below are just some of the results we had received from our food.


Observation/Results: My group and I created a graph demonstrating what the outcome of all the food was below.

Conclusion: So in the end my hypothesis was not correct because the Doritos did not require the most muscle activity. the marshmallows did with a .805 as the mV. The food with the least muscle activity was the peanut butter with a .216 as the mV. Our group did not expect the results that we had received, in order from the most muscle activity to the least was the marshmallow with a .805, Twix with .708, vanilla wafers with a .683, Doritos with .621, cake with .55, and then peanut butter with a .216. So between the greatest and least muscle activity  there was a .589 difference. This lab was quite interesting with the ending results, we were able to learn the different strains our muscles are put through daily with the food we eat.